Case Study: An Edge Gateway Collecting Sensor Readings Over HTTP With kvsqld
An edge gateway sits between a set of devices and the rest of the world. Sensors post readings to it, a dashboard on the same network shows the latest value per device, and someone asks about history: averages, peaks, the hour a fridge ran warm. The gateway is often a small box with no room for a database team, so it should be one program and one file.
This case study runs that set-up with kvsqld. Twenty simulated devices post readings over HTTP on their own connections, while a dashboard reads the latest value by key and asks SQL for history. It’s part of case_studies.rs in the repository. The figures are from its recorded run of October 22, 2026, on a real file on a Linux container with two virtual CPUs. The output is in case-studies.md.
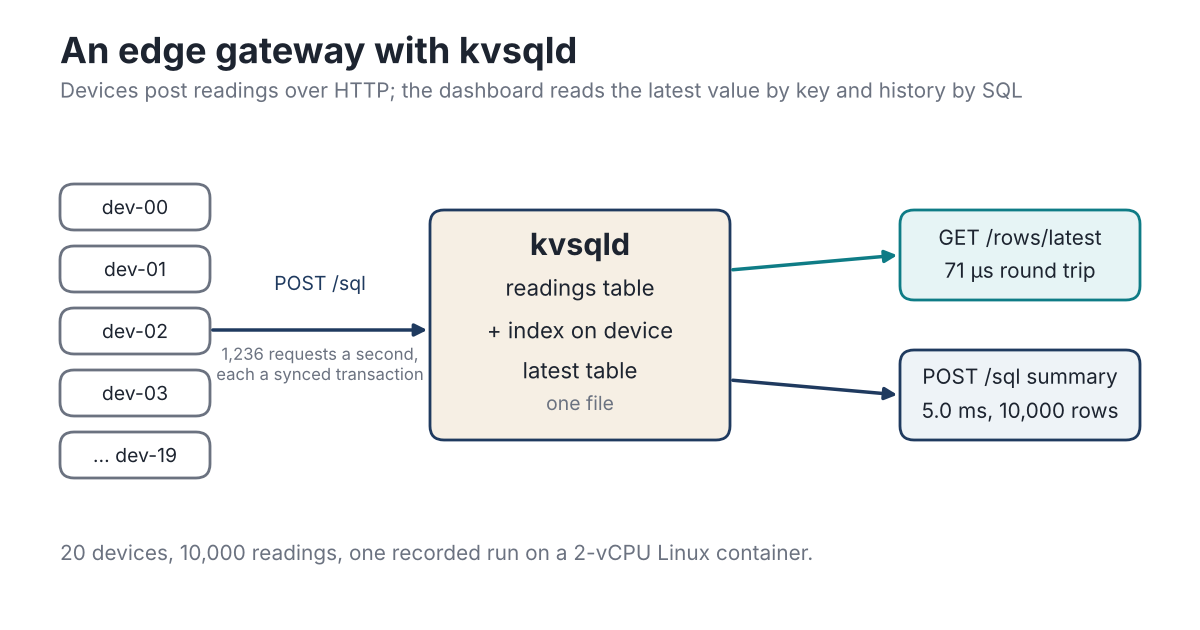
The gateway in the recorded run: twenty devices in, a dashboard out, one file.
Two Tables, One Request per Reading
CREATE TABLE readings (id INTEGER PRIMARY KEY, device TEXT NOT NULL, ts INTEGER NOT NULL, temp REAL);
CREATE INDEX readings_device ON readings(device);
CREATE TABLE latest (device TEXT PRIMARY KEY, ts INTEGER, temp REAL);
Each reading is one POST /sql with three statements. It inserts the history row, removes the device’s previous latest value and inserts the new one. The server runs a request as one transaction and answers only after the commit is on disk. So the history and the latest value never disagree, even if the gateway loses power between two readings.
The twenty devices sent 500 readings each, 10,000 in all, in 8.1 seconds. That’s about 1,236 requests a second, every one a synced commit. Device 7 ran hot for forty readings in the middle of its run.
The Dashboard
The tile that shows each device’s current value doesn’t need SQL:
curl -s localhost:7878/rows/latest/dev-19
{"row":["dev-19",1800014970,23.8]}
2,000 such reads took 71 µs each, HTTP round trip included. History goes through SQL on the same server:
SELECT device, count(*), round(avg(temp), 2), max(temp) FROM readings
  GROUP BY device ORDER BY max(temp) DESC LIMIT 3;
SELECT device, count(*), min(ts), max(ts) FROM readings WHERE temp > 30.0 GROUP BY device;
The summary over all 10,000 readings took 5.0 ms and put dev-07 on top with a peak of 34.9 °C. The alert query took 3.4 ms. It found exactly one device over 30 °C, dev-07, with 40 readings between timestamps 1800006000 and 1800007170. That was the overheating spell, start to end. One device’s history through the index took 0.6 ms. GET /verify at the end checked every page, row and index entry, and passed.
What It Shows
One program and one file did the gateway’s whole job. There was a fast read by key for the live view, SQL for history and alerts, and atomic writes that keep both views in step. Any language that can make an HTTP request can be a device or a dashboard. And kvsqld’s crash tests cover exactly this pattern: a server killed under load, with every confirmed write found afterwards.